


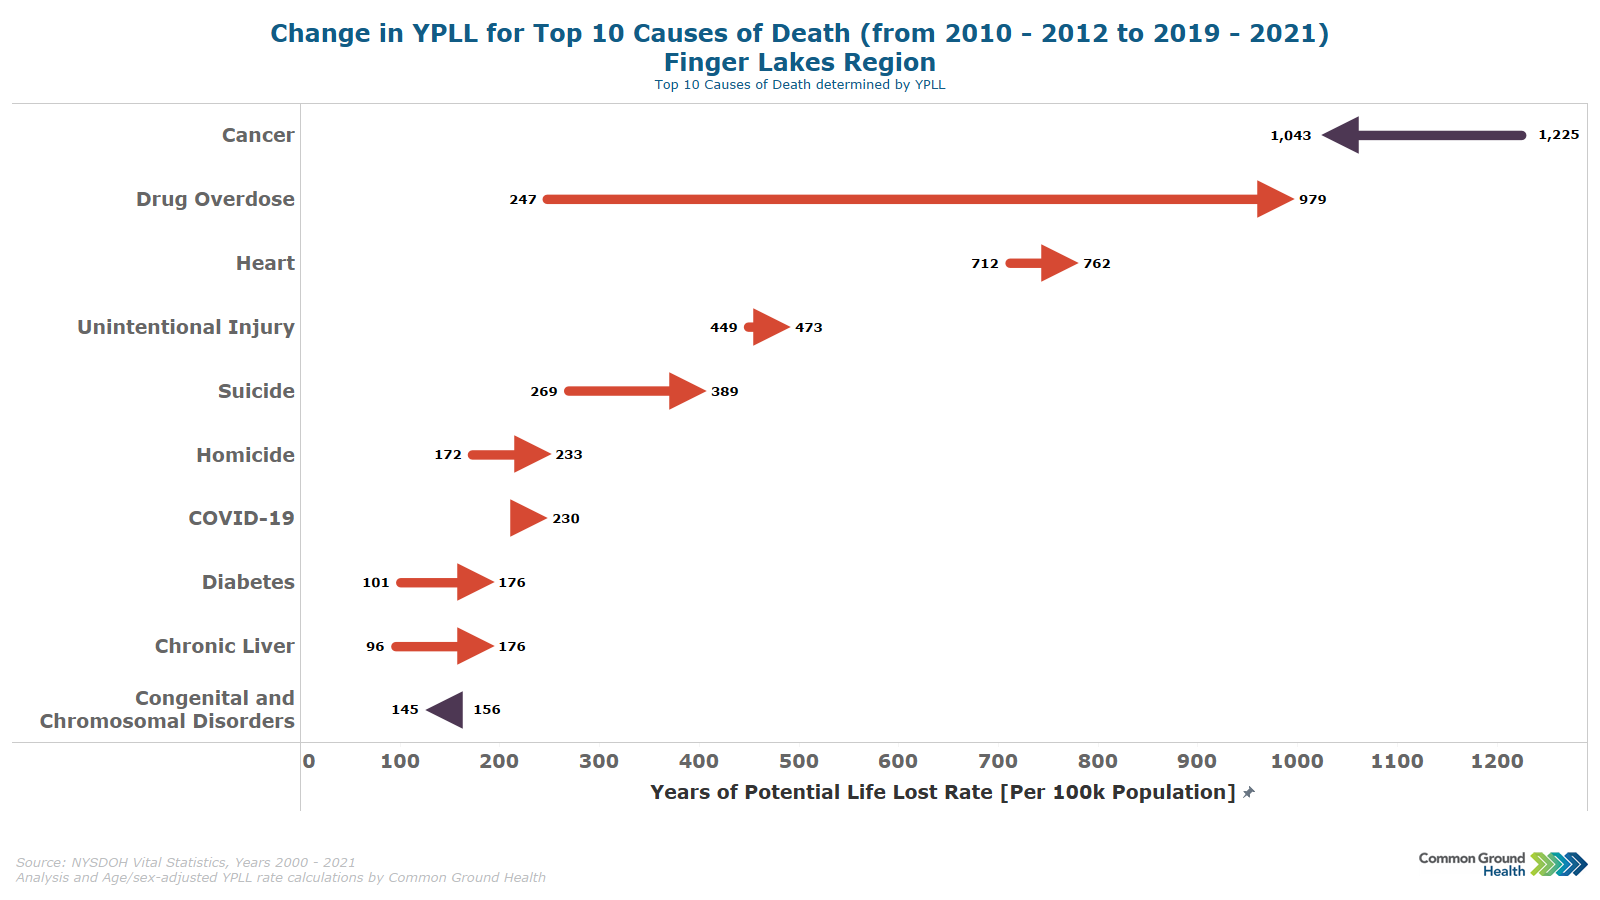
Change in YPLL for Top 10 Causes of Death (from 2010 - 2012 to 2019 - 2021)
Finger Lakes Region
Methodology note: Years of potential life lost (YPLL) is a widely used measure to assess the rate of premature mortality. YPLL places a larger weight on the deaths of younger people, in contrast with overall mortality statistics which are dominated by deaths of the elderly. The YPLL rates in Common Ground Health analyses are derived using 75 years as the baseline. A death at age 65 has YPLL of 10, where as a death at age 35 has a YPLL of 40. The rates are calculated per 100,000 population and are age-sex adjusted to account for differences in population distribution.
Images are available for download at no cost and free of any copyright restrictions. We ask that you keep the Common Ground logo on the images to identify the source. To help us improve, we’d love to hear how you are using these resources. Email us at communications@commongroundhealth.org.


