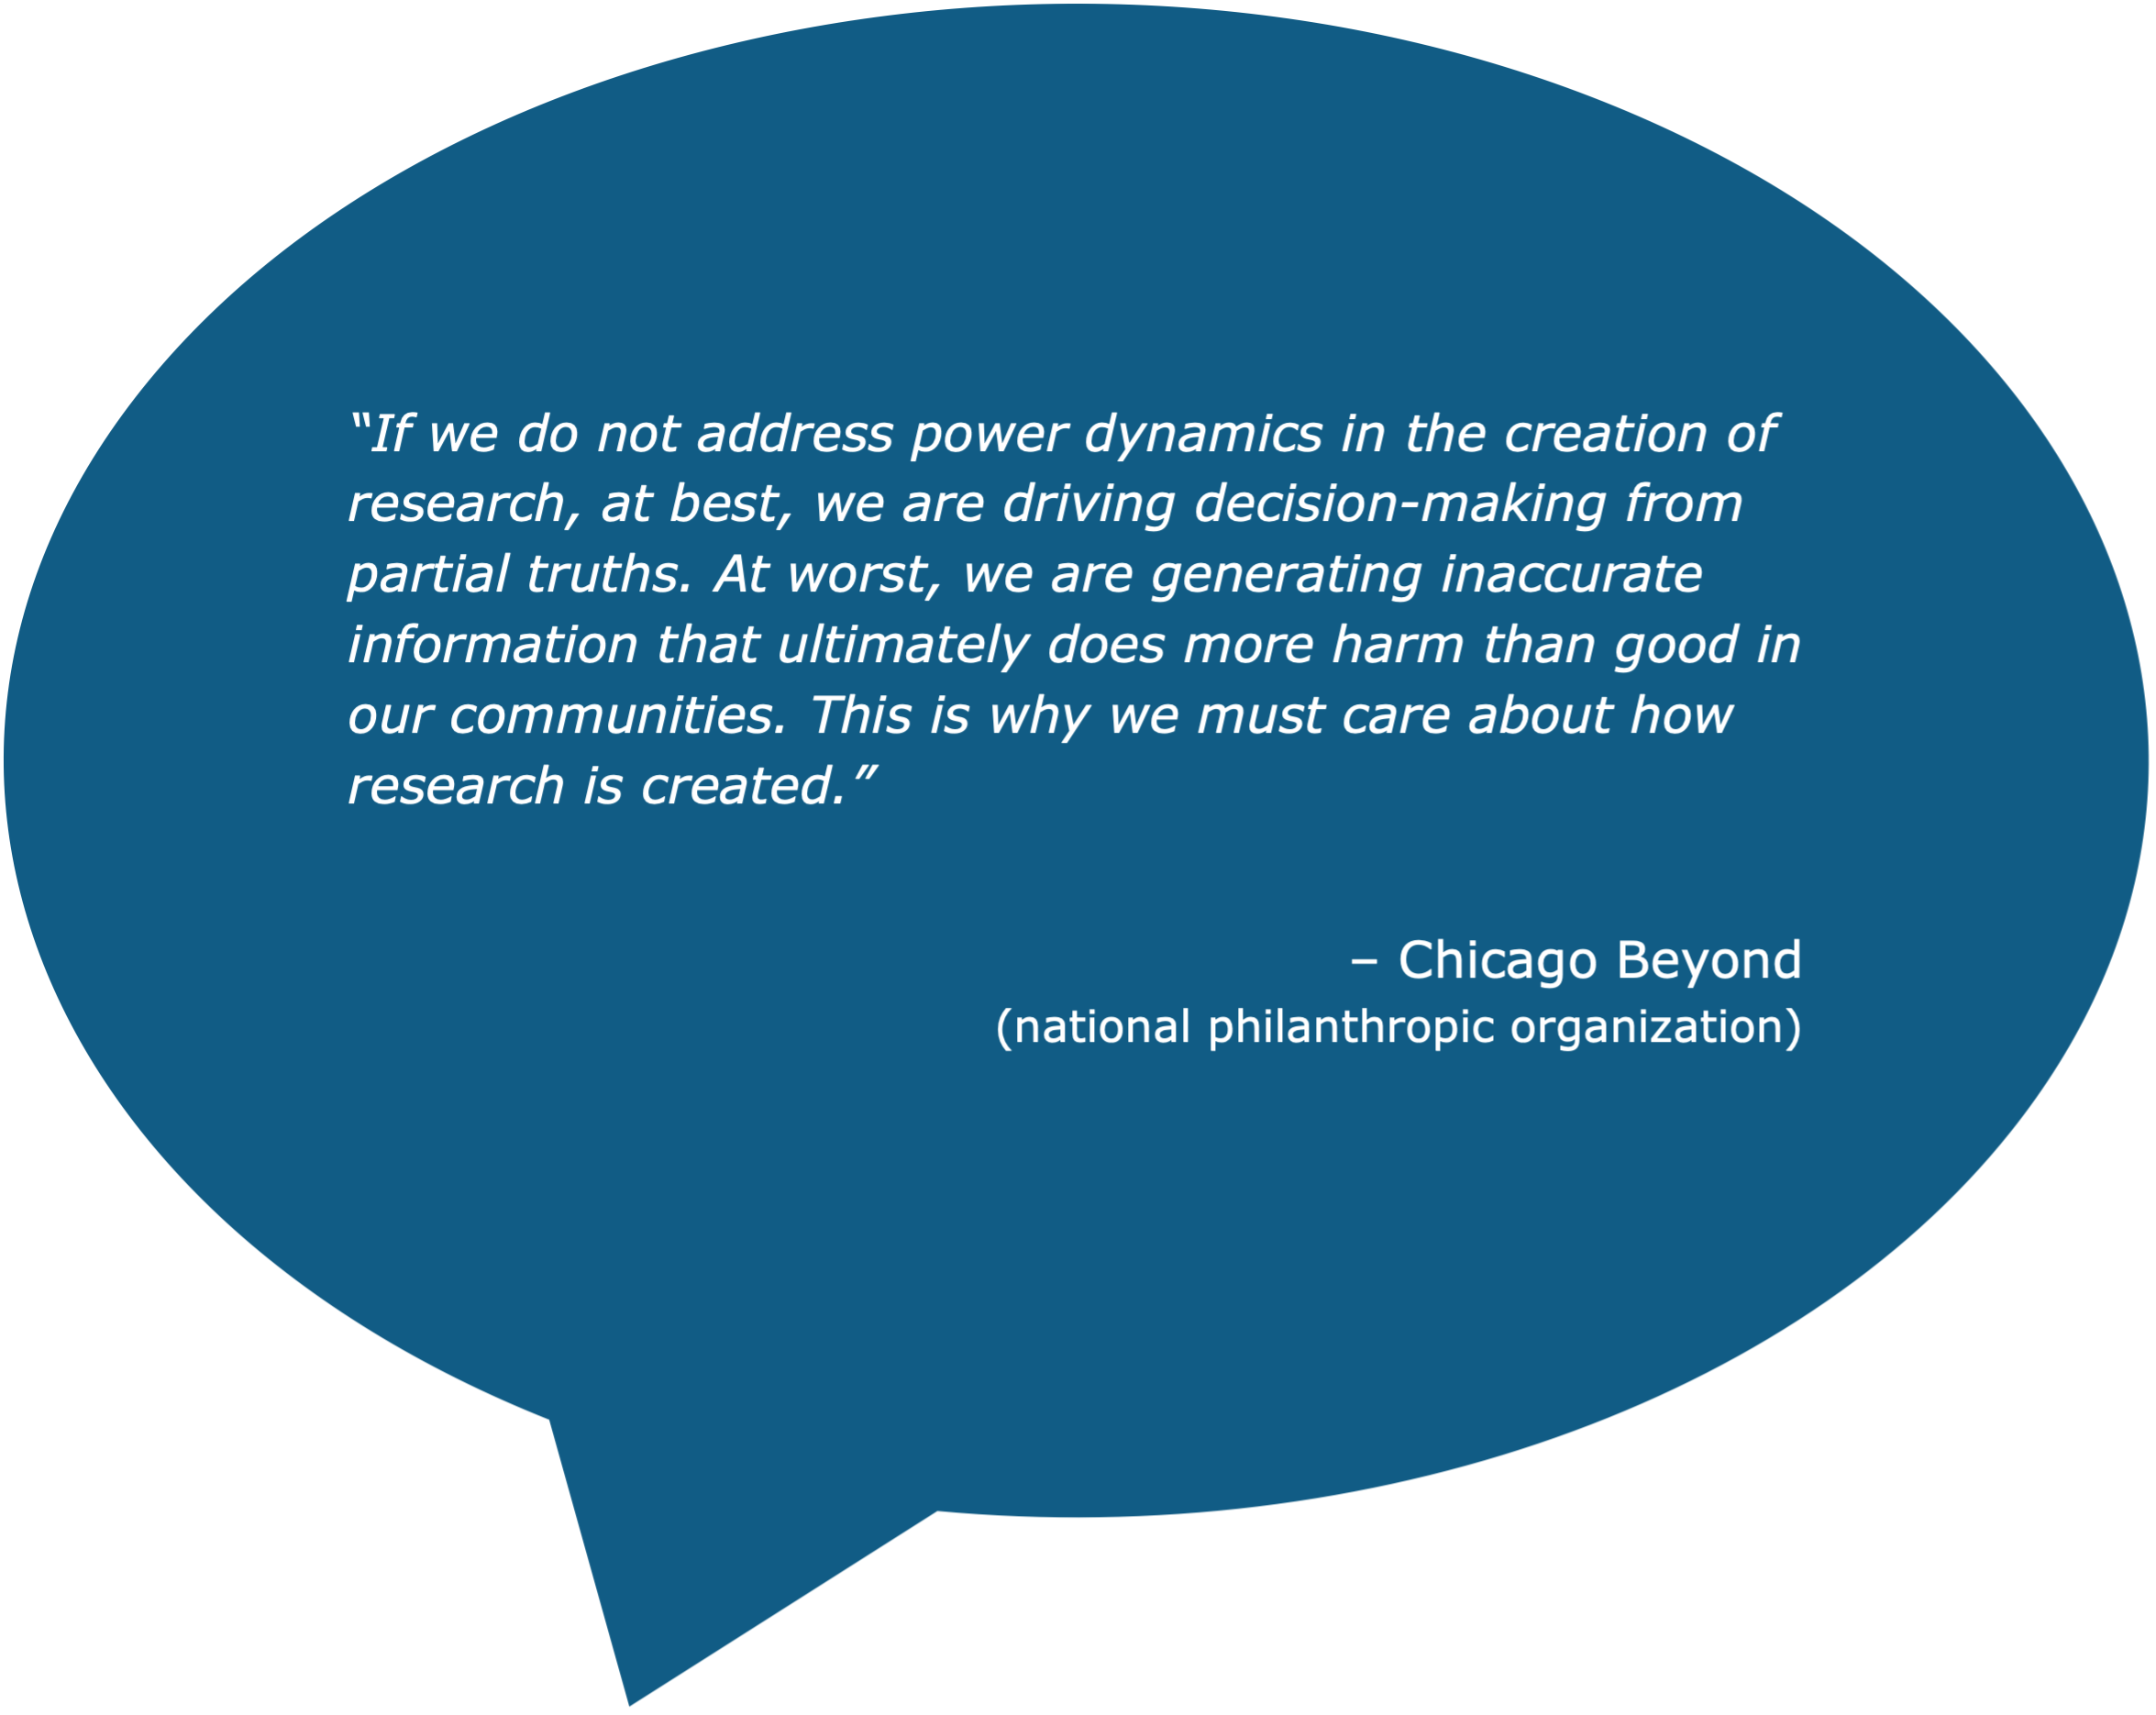
There is power in data. It drives decisions, influences funding, and can change lives…for better or worse. Implicit biases influence the decisions we make, including data decisions. Biases infiltrate data, potentially skewing or discrediting findings.
Common Ground Health is on a journey to embed data equity principles into our research and analytic processes to ensure that our work is inclusive, equitable, and minimizes potential biases.
Potential for bias exists at every stage of research and analytic processes. To mitigate biases in our work, staff participate in data equity training utilizing an approach developed by Heather Krause at We All Count. We actively integrate and adapt these principles to fit the work we do.
What do we mean by data equity?
- Data are not objective;
- Data can create and perpetuate power dynamics;
- Equity needs to be considered throughout each phase of the data life cycle.
How do we integrate data equity principles into our work?
- Funding
- Motivation
- Project design
- Data collection and sourcing
- Analysis
- Interpretation
- Communication and distribution
Here are examples of ways in which we have embedded and adapted these phases, as necessary, to integrate equity into our data work.
Project Design: Biases can infiltrate all elements of project design if we do not critically assess the ways in which data are collected. Data collection instruments including survey tools, assessment forms, and interview and focus group guides can quickly derail well-intentioned projects if not examined through an equity lens. We find that intentional partner engagement is critical to equitable work. Partner organizations and community residents have provided us with feedback on our data collection tools. They let us know when they may not have felt included in our response options on a survey or when they felt that one of our questions has a “judgy tone.”
They also let us know what data is important for them so that we can integrate it into our work. For example, members of the Indigenous community in our area wanted to know what specific tribes were located in our region. We were able to build simple skip logic into our tool so that if someone indicated that they identified as American Indian / Alaska Native, they would be prompted to share their tribal membership. In a different example, based on the suggestion of a partner organization, we added a section for fathers and non-birthing parents to a survey we were developing after they noted that maternal and child health section was not as inclusive as it should be.
We also examine the roles of partner organizations and community residents beyond providing feedback and input on tools. Intentional engagement of partners is critical, whether through a Community Advisory Group or Memorandums of Understanding. Community-based organizations and community residents have helped us to frame questions and responses, think through recruitment strategies and how best to reach the audience that we want to hear from, and determine what incentives may work best for different groups of people.
- The source of the dataset
- Who is included in this dataset
- Who is excluded from this dataset
- When the data was collected
- Times when data was intentionally not collected
- Where data were collected
- Why data were collected
- Any limitations with how data were collected
Communication and Distribution: Like interpretation, narratives form through specific lenses and perspectives. At the communication and distribution phase, we need to consider key points, including:
- Who creates the narrative?
- What perspectives or lenses might they be utilizing?
- Is a group being described who have not had the opportunity to provide insights and context to analyses?
- Who reviews and has editing rights?
- Who has access to the data and at what level?
- Who is centered (or not) in data visualizations?
If analyses focus on a specific group of people, then members of that specified group must have the opportunity to offer context, alternate interpretations, and insights into the ways in which this information is documented and communicated.
Additionally, we modified our approach for depicting race and ethnicity in data visualizations. Our previous model included three main groups: Hispanic, Non-Hispanic Black, and Non-Hispanic White. All other races were omitted from charts and graphs due to small sample sizes within our region. We now include an “All” line in visualizations so that people identifying as Asian, American Indian/Alaska Native, Pacific Islander, Middle Eastern, and those who prefer not to say are still included and represented in the data. While still not a perfect solution, this shift allows for more residents to be visually depicted in our analyses.
How do we continue to advance data equity?

We continue to integrate data equity principles into our research and analytic work. We also continue to promote data collection efforts among community-based organizations and non-academic researchers. Diverse perspectives are vital to advancing data equity. If CBOs do not have the capacity to collect their own data, we are committed to sharing as much data with them as possible while maintaining the terms of each data set. We have yet to integrate the entirety of these principles into one project but will continue to strive to do so.

